What is Kubecost?
Kubecost is a multi-cluster, real-time cost visualization and monitoring tool for your Kubernetes environment. It helps in granular breakdown of costs based on Kubernetes concepts such as deployment, service, namespace label, and provides a unified dashboard across multi cluster for visualization.
Kubecost Architecture
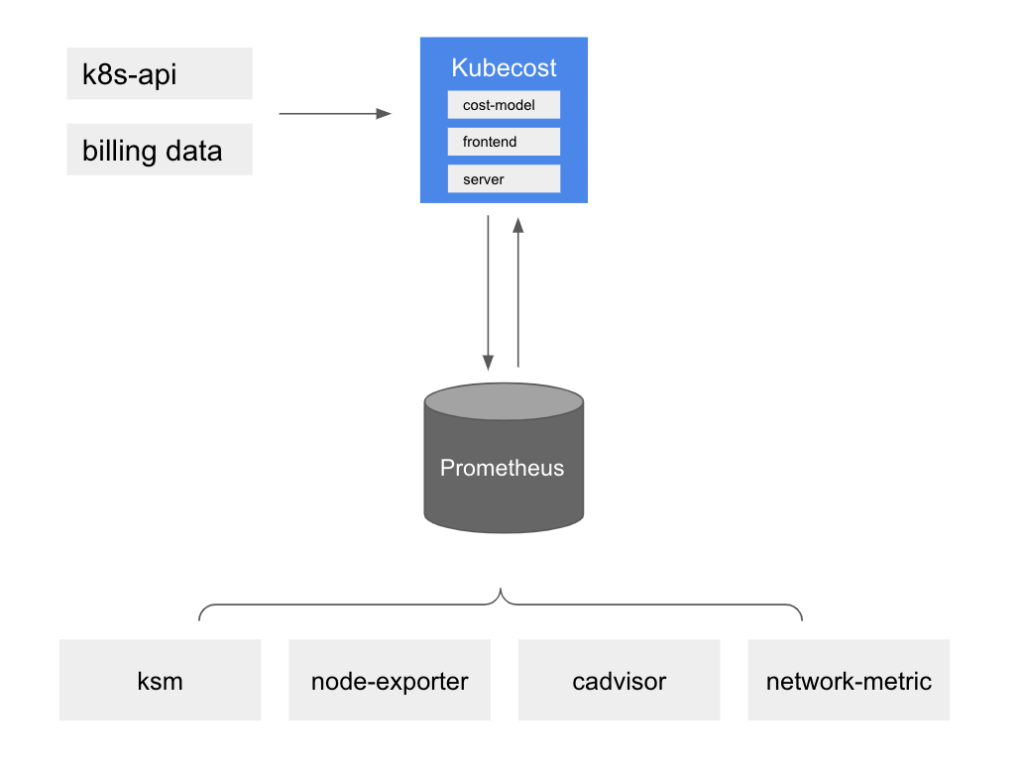
Source: guide.kubecost.com
- The kubecost pod consists of a frontend container which runs Nginx and handles routing to Kubecost backend plus Prometheus/Grafana, a cost model container which provides cost allocations calculations and metrics, both reads and writes to Prometheus.
- Prometheus Server acts as a Time Series Data Store for cost & health metrics.
- Kube State Metrics generates metrics about the state of Kubernetes Objects.
- Node-exporter provides metrics for Reserved Instance Recommendations, various Kubecost Grafana Dashboards, and cluster health alerts.
- Cadvisor for generating metrics of the container.
- Network-metric is a daemon set for collecting networking metrics from all the nodes.
The kubecost pod intakes billing data from the custom pricing we provide or goes with the default cost details for all the major cloud providers.
Steps to Install Kubecost with existing kube-state-metrics & Node-Exporter (Recommended)
Considering you have kube-state-metrics and node exporter running on your cluster, run below command to setup kubecost:
helm upgrade –install kubecost \
–repo https://kubecost.github.io/cost-analyzer/ cost-analyzer \
–namespace kubecost –create-namespace \
–set prometheus.nodeExporter.enabled=false \
–set prometheus.serviceAccounts.nodeExporter.create=false \
–set prometheus.kubeStateMetrics.enabled=false
Dependency Requirements:
– prometheus – v2.18 (support for v2.13 – v2.17 with limited features.)
– kube-state-metrics – v1.6.0+ (May 19)
– cAdvisor – kubelet v1.11.0+ (May 18)
– node-exporter – v0.16+ (May 18) [Optional]
Once kubecost is installed, you can port-forward the cost-analyzer deployment onto your localhost and access the dashboard
kubectl port-forward deploy/kubecost-cost-analyzer –address 0.0.0.0 9090:9090 -n kubecost
Kubecost Dashboard
In the overview section you can check all the offerings from kubecost in a precise manner. We will drill down all the offerings one by one.
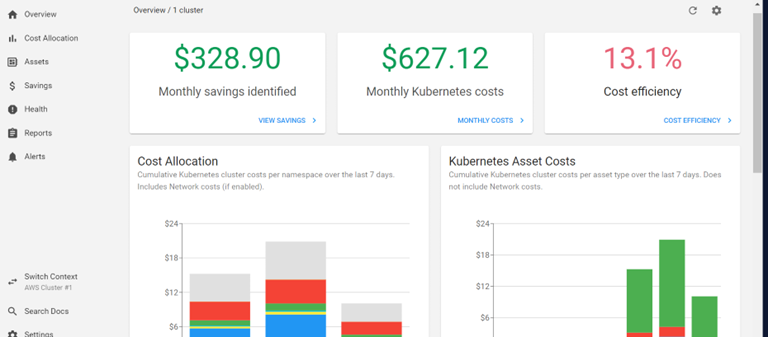
Overview of Dashboard
Cost Allocation provides an opportunity to dig down on your Kubernetes Costs based on Namespace, Services, Cluster, Container, Pod and much more. It gives you an insight where your costs are going high and if it crosses your budget threshold you can easily optimize the required resources, also you can compare the costs with data as old as three months.
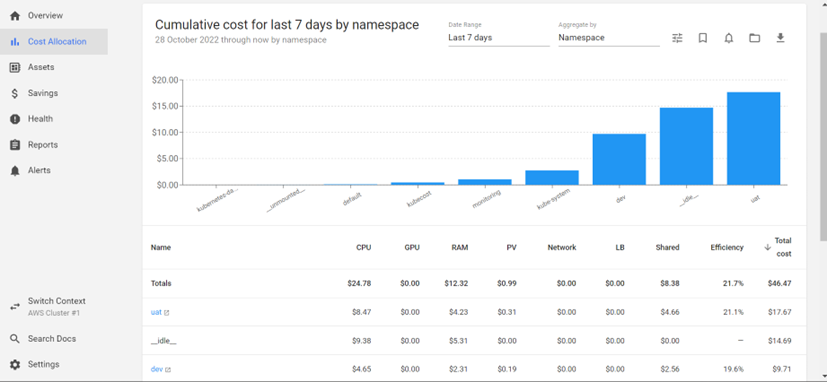
Overview of Dashboard
You also have an option to dig into a namespace and find out the costs related to that namespace with bar graphs. It also has the option which will suggest you the cost optimization possible for that namespace and figure out under and over provisioned resources.
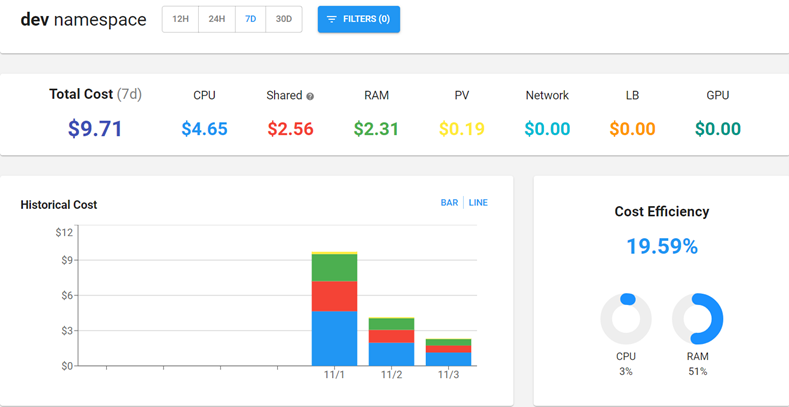
Overview of Dashboard
Drill down an option to find granular cost details
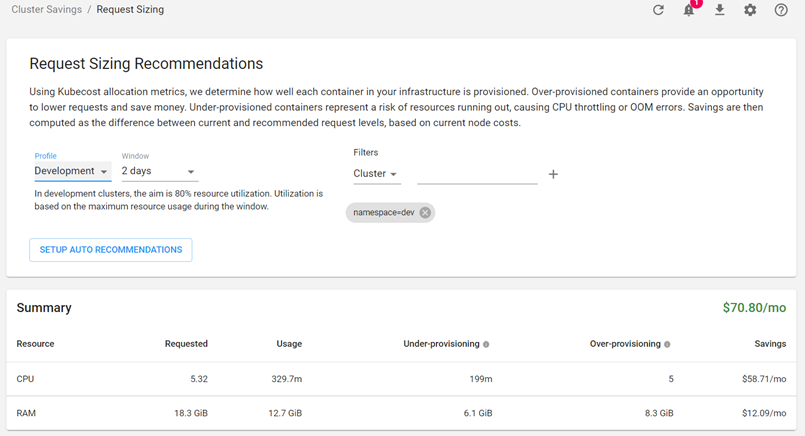
Resource Sizing Recommendations
The savings sections gives you an approximate figure on the cost you can save on a monthly basis, with visibility on under and over provisioned and unused resources. Also kubecost detects workloads which are not receiving sufficient traffic and lists them under abandoned workloads.
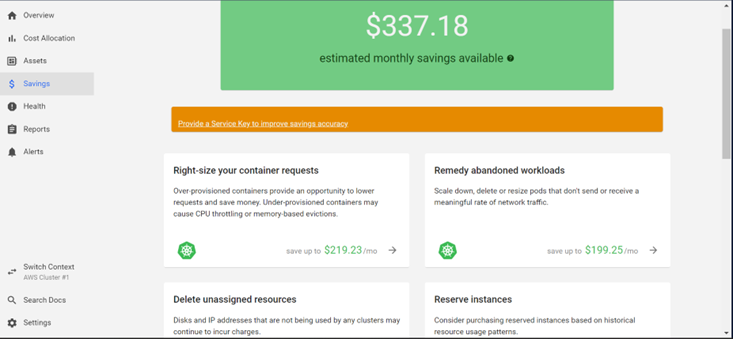
Savings
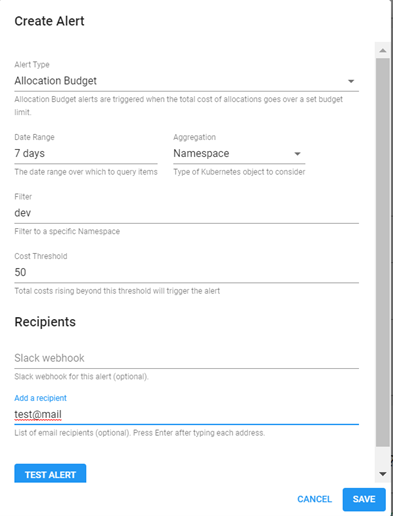
In the Alert section you can Create Alerts based on your budget for a particular namespace, service, deployment etc and receive mails or slack alerts once the budget is exceeded.
Access Kubecost using CLI (Krew Plugin)
Install Krew:
(
set -x; cd “$(mktemp -d)” &&
OS=”$(uname | tr ‘[:upper:]’ ‘[:lower:]’)” &&
ARCH=”$(uname -m | sed -e ‘s/x86_64/amd64/’ -e ‘s/\(arm\)\(64\)\?.*/\1\2/’ -e ‘s/aarch64$/arm64/’)” &&
KREW=”krew-${OS}_${ARCH}” &&
curl -fsSLO “https://github.com/kubernetes-sigs/krew/releases/latest/download/${KREW}.tar.gz” &&
tar zxvf “${KREW}.tar.gz” &&
./”${KREW}” install krew
)
Export PATH:
export PATH=”${KREW_ROOT:-$HOME/.krew}/bin:$PATH”
Install Kubecost Krew Plugin:
kubectl krew install cost
Check cost of Pods:
kubectl cost pod –n kubecost
You will get detailed breakdown of cost on container level.

Uninstall Kubecost
helm delete kubecost –n kubecost


